
Methods
Data sources
In this modelling study, we included data on country-level estimates of R from the EpiForecasts project by the London School of Hygiene & Tropical Medicine (London, UK).
- Abbott S
- Hellewell J
- Thompson R
- et al.
Briefly, the instantaneous reproduction number is estimated based on the daily counts of confirmed COVID-19 cases reported by the European Centre for Disease Prevention and Control. The instantaneous reproduction number represents the average number of secondary cases that would arise from a primary case infected at a given time if the conditions remained identical after that time, and thus measures the instantaneous transmissibility.
- Cori A
- Ferguson NM
- Fraser C
- Cauchemez S
The modelling framework accounts for reporting delay between symptom onset and case notification, right truncation of notification dates, and the delay between onset and infection based on empirical data to ensure that temporal variations in R can be compared directly with the times at which NPIs were implemented.
- Abbott S
- Hellewell J
- Thompson R
- et al.
We included data on country-specific policies on NPIs from the Oxford COVID-19 Government Response Tracker (OxCGRT).
- Hale T
- Webster S
- Petherick A
- Phillips T
- Kira B
OxCGRT was established by a dedicated team of public policy and governance experts, who collect publicly available information on indicators of government response. In OxCGRT, NPIs are grouped into the following eight categories: closure of schools, closure of workplaces, public events bans (eg, sports, festive, and religious events), restrictions on the size of gatherings, closure of public transport, stay at home orders, restrictions on internal movement, and restrictions on international travel. Country-specific information on each of the NPIs is available on a daily basis (since Jan 1, 2020). We also included data on testing policy and contact tracing of each country from OxCGRT for sensitivity analyses.
Data processing
Data analysis
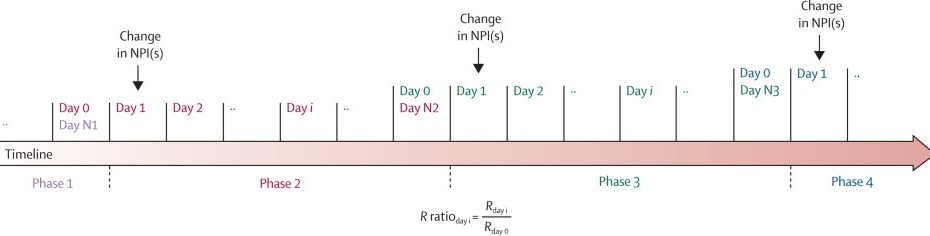
We defined a phase as a time period when all of the eight NPIs remained the same, and we divided the timeline of each country into individual phases based on the status of NPIs. We first described the duration of phases, the frequency of introducing and lifting each NPI, and the temporal order of introducing and lifting each NPI. For each phase, we defined Rday i as the R of the ith day of that phase (ie, since the NPI status changed) and defined Rday 0 as the R of the last day of its previous phase (ie, before the NPI status changed). As the effect of NPIs on transmission (measured as R) is expected to be relative to its original level, we calculated the R ratio between Rday i and Rday 0 as a measure of the degree of association of introducing and lifting an NPI (or NPIs) with the transmission of SARS-CoV-2 (figure 1). An R ratio of more than 1 indicates an increase in transmission since the change in the NPI (or NPIs), and an R ratio of less than 1 indicates a decrease in transmission. On the basis of the change of NPIs between two neighbouring phases and the corresponding R ratio, we were able to assess the effect of introducing or lifting each of the NPIs.

Figure 1Schematic presenting calculation of the R ratio
Day i is defined as the ith day of the phase (ie, since NPI status changed). Day N represents the last day of the phase. Note that different phases could have different numbers of days. NPI=non-pharmaceutical intervention. R=time-varying reproduction number.
In the main analysis, we modelled the R ratio using a log-linear regression, with the following equation, for each day of the first 28 days following the change in the corresponding NPI (ie, a total of 28 separate models):
log(Yt)=β0t+β1tX1t+β2tX2t+…+β16tX16t+β17tZ1t+β18tZ2t
where Yt represents the R ratio on day t (t=1, 2, …, 28);
are binary indicators of whether each of the eight NPIs are introduced and lifted, respectively; and
are binary indicators of whether multiple NPIs are introduced and lifted simultaneously, respectively. Hence,
represents the baseline change in R on day t in the absence of changes in NPI status;
represent the individual effects of introducing and lifting NPIs on day t, respectively; and
represent the interaction between introducing and lifting, respectively, multiple NPIs as they are introduced and lifted simultaneously. No days beyond the first 28 days following the change were included due to limited data availability.
We did a series of sensitivity analyses. First, we replaced the NPI of a ban on gatherings of more than ten people with a ban on gatherings of more than 100 people in the model to understand how limiting public gatherings of different sizes could affect the transmission. Second, we presented the effect of individual NPIs by only including phases in which just one NPI was changed. Third, we used a different comparator, the mean R for the 7 days before NPI status change (rather than R for the day before NPI status change), when calculating the R ratio. Fourth, we excluded early phases in which the country’s first NPI was introduced. Fifth, we excluded large countries that could have greater regional variability in NPI policies: Brazil, Canada, China, India, Russia, and the USA. Sixth, we did 20 sets of analyses, each of which randomly excluded ten countries from the dataset, to understand how our estimates had been affected by possible outliers. Seventh, we included only the phases with comprehensive testing (defined as the requirement to test anyone with COVID-19 symptoms) in the analysis, since testing practice could affect the estimate of R. Eighth, we included only the phases with comprehensive contact tracing (defined as the requirement to trace contacts for all COVID-19 cases) to understand how contact tracing could modify the effect of NPIs in our model.
In addition, based on the modelled effect of individual NPIs from our main analysis, we did an ad-hoc analysis to estimate the effect of reintroducing multiple NPIs (those with the greatest effects and following the observed sequence of introducing NPIs) to tackle the possible resurgence of SARS-CoV-2. We considered four candidate strategies for the reintroduction: candidate 1 included a ban on public events and gatherings of more than ten people; candidate 2 included workplace closure as well as a ban on public events and gatherings of more than ten people; candidate 3 included workplace closure, a ban on public events and gatherings of more than ten people, and internal movement limits; and candidate 4 included school and workplace closure, a ban on public events and gatherings of more than ten people, internal movement limits, and requirements to stay at home.
Role of the funding source
The funders of the study had no role in study design, data collection, data analysis, data interpretation, writing of the manuscript, or the decision to submit for publication. All authors had full access to all the data in the study and were responsible for the decision to submit the manuscript for publication.
Results
790 phases from 131 countries were included in the analysis (see appendix pp 8–40 for details on daily R estimates and NPI status for each country). The median duration of phases was 11 days (IQR 3–27), with the shortest median duration observed in phases in which closure of schools (3 days [1–8]) and public events bans (4 days [2–7]) were introduced (appendix p 41). Requirements to stay at home and restrictions on internal movements were the most common NPIs introduced, and were most often introduced and lifted simultaneously (figure 2). With regard to the temporal sequence of introducing and lifting NPIs, closure of schools and public events bans were the first two NPIs introduced and were lifted later than most NPIs. Requirements to stay at home and closure of public transport were the last two NPIs introduced and were lifted earlier than most NPIs (figure 2).

Figure 2Frequency (A) and order (B) of introducing and lifting NPIs
(A) Each number denotes the frequency of the co-occurrence of NPIs in the x and y axes. Numbers on the diagonal (from bottom left to top right) denote the frequency of the occurrence of NPIs (with and without co-occurrence). (B) Each number in the graph denotes the percentage of NPI in the y axis that occurred earlier than the NPI in the x axis among countries with both NPIs ordered or lifted. NPIs are ranked from earliest to latest based on the mean percentage of the row. NPI=non-pharmaceutical intervention.
According to the results from the main analysis, a decreasing trend over time in the R ratio was found in the first 14 days following the introduction of school closure, workplace closure, public events bans, requirements to stay at home, and internal movement limits (figure 3); the reduction in R ranged from 3% to 24% on day 28 following the introduction (table 1). The introduction of a public events ban was associated with the highest reduction in R; the R ratio was 0·90 (95% CI 0·82–0·99) on day 7, 0·83 (0·68–1·00) on day 14, and 0·76 (0·58–1·00) on day 28 (table 1). An increasing trend over time in the R ratio was found following the relaxation of school closure, bans on public events, bans on public gatherings of more than ten people, requirements to stay at home, and internal movement limits, especially after the first week after relaxation; the increase in R ranged from 11% to 25% on day 28 following the relaxation (figure 3). The relaxation of school closure was associated with the greatest increase in R on day 7 (R ratio 1·05, 95% CI 0·96–1·14) and day 14 (1·18, 1·02–1·36). The relaxation of a ban on gatherings of more than ten people was associated with the greatest increase in R on day 28, with an R ratio of 1·25 (95% CI 1·03–1·51) on day 28. Negative interaction––ie, towards an R ratio of 1—was identified when multiple NPIs were introduced or lifted simultaneously (appendix p 42).

Figure 3Change over time in the R ratio following the introduction and relaxation of individual NPIs
For each NPI, the reference period is the day before introduction or relaxation of that NPI. An R ratio of more than 1 indicates increased transmission, and an R ratio of less than 1 indicates decreased transmission. The error bars present the 95% CIs of the R ratios derived from the model. NPI=non-pharmaceutical intervention. R=time-varying reproduction number.
Table 1Change in the R ratio over time on day 7, day 14, and day 28 after the introduction and relaxation of each NPI
Data are R ratio (95% CI). For each NPI, the reference period is the day before introduction or relaxation of that NPI. An R ratio of more than 1 indicates increased transmission, and an R ratio of less than 1 indicates decreased transmission. NPI=non-pharmaceutical intervention. R=time-varying reproduction number.
When comparing the effect of a ban on gatherings of more than ten people with that of a ban on gatherings of more than 100 people, we found that both bans were associated with a decrease in the R ratio in the first week, followed by an increase in the R ratio starting from the second week, but the increase was more pronounced for the ban on gatherings of more than 100 people, with R ratios above 1 after day 14 (figure 4). When lifting these two bans, we observed a delayed increase in R for the ban on gatherings of more than ten people (appendix p 45); on day 14, the R ratio was 1·07 (95% CI 0·96–1·20) for lifting the ban on gatherings of more than ten people and 1·23 (1·07–1·42) for lifting the ban on gatherings of more than 100 people (figure 4).

Figure 4Change over time in the R ratio following the introduction and relaxation of a ban on public gatherings of different sizes
The error bars present the 95% CIs of the R ratios derived from the model. R=time-varying reproduction number.
On the basis of the results from the main analysis, we estimated the effects of four candidates of composite NPIs (table 2; appendix p 53). The greatest reductions in R were seen for candidate 4 (school and workplace closure, plus a ban on public events and gatherings of more than ten people, internal movement limits, and a requirement to stay at home) at all timepoints (table 2).
Table 2Modelled change in the R ratio over time on day 7, day 14, and day 28 after the introduction of different composites of NPIs
Data are R ratio (95% CI). The reference period is the day before introduction of an NPI. An R ratio of more than 1 indicates increased transmission, and an R ratio of less than 1 indicates decreased transmission. NPI=non-pharmaceutical intervention. R=time-varying reproduction number.
Discussion
To the best of our knowledge, this study is the first to assess the temporal association between changing the status of a range of NPIs and the transmission of SARS-CoV-2, as measured by R, for all countries for which data were available. On the basis of the empirical data from 131 countries, we found that individual NPIs, including school closure, workplace closure, public events bans, requirements to stay at home, and internal movement limits, were associated with reductions in R of 3–24% on day 28 after their introduction, compared with the day before their introduction. Reopening schools, lifting bans on public events, lifting bans on public gatherings of more than ten people, lifting requirements to stay at home, and lifting internal movement limits were associated with increases in R of 11–25% on day 28 after the relaxation. The effects of introducing and lifting NPIs were not immediate; it took around 1 week following the introduction of an NPI to observe 60% of the maximum reduction in R and even longer (almost 3 weeks) following the relaxation of an NPI to observe 60% of the maximum increase in R. Our analysis suggests that, in the context of a resurgence of SARS-CoV-2, a control strategy of banning public events and public gatherings of more than ten people would be associated with a reduction in R of 6% on day 7, 13% on day 14, and 29% on day 28; if this strategy also included closing workplaces, the overall reduction in R would be 16% on day 7, 22% on day 14, and 38% on day 28. These findings provide additional evidence that can inform policy makers’ decisions on the timing of introducing and lifting different NPIs.
Our findings on the effects of introducing NPIs were broadly in line with the findings from Flaxman and colleagues’ multicountry study that assessed the impact of different NPIs among 11 European countries.
- Flaxman S
- Mishra S
- Gandy A
- et al.
Flaxman and colleagues reported that several NPIs (eg, school closure and public events ban), and lockdown in particular, had a large effect (81%) on reducing transmission.
- Flaxman S
- Mishra S
- Gandy A
- et al.
However, Flaxman and colleagues did not assess changes over time in the effect of lockdown and assumed that the effect was immediate. In this study, we estimated that an extreme intervention similar to lockdown, consisting of school and workplace closure, bans on public events and gatherings, requirements to stay at home, and limits on internal movement, could reduce R by 35% on day 7, 42% on day 14, and 52% on day 28. Our findings on the effects of introducing NPIs were also qualitatively similar to those from a study by Islam and colleagues that modelled the incidence rate ratio of COVID-19 with OxCGRT NPI data,
- Islam N
- Sharp SJ
- Chowell G
- et al.
although that study did not assess the effects of lifting NPIs.
Our analysis demonstrates that the effect of introducing and lifting NPIs was not immediate and that the time required to reach certain levels of effect differed by NPI. This finding provides important evidence to policy makers on when to expect a notable effect from introducing or lifting an NPI. The observed delay of effect could be explained by behavioural inertia, which is supported by the similar immediacy results of NPIs between using R and using Google mobility data.
School closure was widely adopted previously to control influenza outbreaks and pandemics, and was shown to reduce and delay peaks of epidemics.
- Bin Nafisah S
- Alamery AH
- Al Nafesa A
- Aleid B
- Brazanji NA
,
- Jackson C
- Mangtani P
- Hawker J
- Olowokure B
- Vynnycky E
For SARS-CoV-2, the role of children in its transmission is still unclear. A modelling study from China showed that school closure alone could not interrupt transmission, but it could potentially reduce peak incidence by 40–60% and delay the epidemic of COVID-19.
- Zhang J
- Litvinova M
- Liang Y
- et al.
In this study, we showed that closing schools alone could decrease transmission by 15% (R ratio 0·85, 95% CI 0·66–1·10) on day 28 and reopening schools could increase transmission by 24% (1·24, 1·00–1·52) on day 28. It should be acknowledged that in our analysis, we were unable to account for different precautions regarding school reopening that were adopted by some countries, such as physical distancing within classrooms (eg, limiting class sizes and placing transparent dividers between students) and outside classrooms (eg, physical distancing during meal times, recreation, and transportation), enhanced hygiene (eg, routine deep cleaning and personal handwashing and face masks), and others (eg, thermal temperature checks on arrival).
- Melnick H
- Darling-Hammond L
- Leung M
- et al.
,
- Sheikh A
- Sheikh A
- Sheikh Z
- Dhami S
Such precautions are imperative for safer school reopening. A COVID-19 outbreak was reported in a high school in Israel 10 days after its reopening; students were in crowded classrooms and were not instructed to wear face masks due to high temperatures.
- Stein-Zamir C
- Abramson N
- Shoob H
- et al.
In addition, it should be noted that we did not consider the normal school holidays in some countries. We were also unable to assess the effect of reopening different levels of school (eg, elementary vs middle schools) since the effect might differ by finer age bands within school-age children and adolescents.
- Stein-Zamir C
- Abramson N
- Shoob H
- et al.
,
- Götzinger F
- Santiago-García B
- Noguera-Julián A
- et al.
A report found that children younger than 5 years with mild to moderate COVID-19 had high viral loads in their nasopharynx compared with older children and adults, and thus could potentially be important drivers of transmission in the general population.
- Heald-Sargent T
- Muller WJ
- Zheng X
- Rippe J
- Patel AB
- Kociolek LK
Our findings suggest that, as a single NPI, banning public events resulted in the greatest reduction in R, with an R ratio on day 28 of 0·76 (95% CI 0·58–1·00). This finding is unsurprising because a ban on crowded activities could prevent superspreading events, which were commonly reported at the beginning of the COVID-19 pandemic.
- Liu Y
- Eggo RM
- Kucharski AJ
Another explanation for the high reduction is that a ban on public events was often the first NPI to be introduced in countries; our sensitivity analysis that excluded NPIs that were introduced first showed a non-significant reduction of transmission with banning public events, with an R ratio of 0·80 (95% CI 0·57–1·11) on day 28.
Our findings also suggest that, within 28 days, lifting public events bans could increase transmission by 21%, although the finding was not significant, and lifting bans on gatherings of more than ten people could increase transmission by 25%, which was the highest increase among all NPIs. We did not observe a substantial reduction in transmission after introduction of bans on gatherings of more than ten or more than 100 people, especially for more than 100 people, which showed an increase in transmission after day 14; possible explanations for this finding include low adherence and, for the ban on gatherings of more than 100 people, an increase in smaller-scale gatherings. In addition, it should be noted that for bans on physical gatherings, we were unable to further stratify our analysis by indoor versus outdoor settings due to scarcity of data.
Notably, we did not observe a substantial difference in our results when including in a sensitivity analysis only phases with comprehensive contact tracing in place. This was not as expected since contact tracing was believed to reduce transmission through early identification of infectious cases. This finding could be due to the lack of representativeness, since only 18% of our data were included in this sensitivity analysis. Nevertheless, a modelling study, which might explain our results, suggested that a contact-tracing strategy will contribute to containment of COVID-19 only if it can be organised in a timely manner that minimises testing and tracing delays.
- Kretzschmar ME
- Rozhnova G
- Bootsma MCJ
- van Boven M
- van de Wijgert JHHM
- Bonten MJM
However, our data lacked the necessary granularity to further explore timeliness of testing and tracing. Additionally, similar to the findings by Islam and colleagues,
- Islam N
- Sharp SJ
- Chowell G
- et al.
we did not observe substantial effects of public transport closure on the R ratio.
There are some advantages to our study. First, both the method for the R calculation and the method for recording NPIs remained consistent over time among different countries, which ensured comparability between different phases in different countries in our analysis. Second, by dividing the timeline into different phases according to the changes in NPIs, we were able to assess the effect of individual NPIs. Third, we were able to estimate the change in the effect of NPIs over time.
We acknowledge several challenges and limitations regarding our analysis. First, our analysis was based on data on control policy rather than on actual population behaviour. In particular, we were unable to account for the growing awareness of personal hygiene (including wearing face coverings) among the public in response to the pandemic. These behavioural changes lead to a further reduction of transmission and are likely to vary over time. We were also unable to examine compliance with these NPIs due to the scarcity of suitable data that were reliable across countries over time. Second, some NPIs (eg, school closure and public events ban) were often introduced earlier than other NPIs (eg, requirements to stay at home); therefore, we were unable to assess the effect of different rank orders of changes in NPI status. NPIs that were introduced earlier might have had a longer-term effect on R and thus might bias the estimates for later NPIs. Third, our data on R and NPIs were at the national level, whereas both R and NPIs could vary among different parts of a country. An increase in national-level R could be due to a clustered outbreak in some areas or due to several scattered cases nationwide. Fourth, we acknowledged the potentially high heterogeneity across different countries in terms of both NPIs and COVID-19 case ascertainment. Our findings should be regarded as a broad summary across the full dataset, and we did not intend to draw any separate conclusions for individual countries. Our sensitivity analyses indicated that our main findings were not sensitive to the removals of different lists of countries. Fifth, individual awareness and personal hygiene have been changing over time since the pandemic started, which could contribute greatly to the change in transmission of SARS-CoV-2 (eg, wearing face masks was uncommon before the COVID-19 pandemic); therefore, the impact on R by future reintroduction and re-relaxation of NPIs might be substantially different. Sixth, we did not consider the role of underlying seasonality or meteorological factors (eg, temperature and humidity) in SARS-CoV-2 transmission. A modelling study found that introduction of NPIs was strongly associated with growth of COVID-19 cases and, by comparison, humidity was only weakly associated with the growth; no association was found for latitude or temperature.
- Jüni P
- Rothenbühler M
- Bobos P
- et al.
Seventh, we only assessed the effect of introducing and lifting NPIs for the first 28 days after introduction and relaxation, and the findings (including the trend) should not be generalised to beyond 28 days. Finally, although our study could essentially be regarded as a natural experiment study,
- Islam N
- Sharp SJ
- Chowell G
- et al.
our findings do not necessarily imply causation.
We acknowledge several limitations of the methodology for the R estimate used in our analysis. First, the adjustment for reporting delays was only done globally and not specific to each country due to the scarcity of available data on reporting delays. This could lead to temporal inaccuracy of R, which could bias our findings on the immediacy of changes in R associated with NPIs. Nonetheless, our findings on the immediacy of changes associated with NPIs were consistent with the results of the analysis using Google mobility data, indicating that the possible temporal inaccuracy of R might have had little impact on the overall findings. Second, the R estimate was subject to the specification of parameters (eg, incubation period and generation time of SARS-CoV-2) in the model and could be biased upwards or downwards. However, we believe it unlikely that this bias affected the main findings of our study because we used the R ratio as the output metric (which cancels out all time-invariant elements related to the R estimate). Third, the modelling framework for R was unable to account for the change over time in eligibility for testing, method of testing, or case definition in different countries. This could bias both the R estimate and the R ratio in our analysis for the dates during which the changes were ongoing. For example, we are likely to observe an artificial increase in R if a country increases the testing capacity within a short period. Last, the uncertainty range of the national R estimate was based on the number of national reported cases and therefore did not reflect any variations in R within the country.
We also acknowledge the innate limitations of R as a measure of transmission of SARS-CoV-2. First, although R is often assumed to have straightforward interpretations in practice, estimating R during an ongoing outbreak is complicated and associated with substantial uncertainty. Second, the estimates of R become unreliable with wider uncertainty range if the number of cases is low, which reduces its applicability at the very local level or when the number of cases in a large region is low. Third, R can be sensitive to a surge in the number of cases in certain settings (eg, care homes, schools, factories, and hospitals) and does not fully represent transmission in the general population. Fourth, R is an average population-level measure of transmission and does not reflect the individual-level transmission of SARS-CoV-2. The potential of SARS-CoV-2 transmission varies among individuals and is reflected by the reported superspreading events.
- Kucharski AJ
- Russell TW
- Diamond C
- et al.
,
- Liu Y
- Eggo RM
- Kucharski AJ
In summary, our findings provide additional evidence that can inform policy makers’ decisions on the timing of introducing and lifting different NPIs. The decisions to reintroduce and relax restrictions should be informed by various factors, including the capacity and resilience of the health-care system, and might be best made at provincial or district rather than national levels in some countries.
YL, HC, and HN conceptualised the study. YL led data acquisition, analysis, and visualisation. HN, HC, and YL led the data interpretation with substantial contribution from DK, AH, MN, and XW. YL wrote the draft report, and all other authors revised the report critically for important intellectual content. All authors have read and approved the final version of the report. YL and HN verified the data linkage of two publicly available datasets and had full access to the linked data.
YL reports grants from WHO, outside the submitted work. HC reports grants from the Innovative Medicines Initiative, UK National Institute for Health Research, and Bill & Melinda Gates Foundation, and grants and personal fees from WHO and Sanofi, outside the submitted work. HN reports grants from the Innovative Medicines Initiative, WHO, and the National Institute for Health Research; personal fees from the Bill & Melinda Gates Foundation, Janssen, and AbbVie; and grants and personal fees from Sanofi and the Foundation for Influenza Epidemiology, outside the submitted work. All other authors declare no competing interests.